HOW DID THE 4TH LOCKDOWN AFFECT MOBILITY IN AUSTRIA?
For mobility analyses in the weeks before and regarding the “lockdown for unvaccinated” (LDfU), please, see the post “Lockdown for the Unvaccinated” and our [German] Policy Brief 6/2021.
Here we present an update of our analyses regarding how mobility in the Austrian population changed during the current “4th Lockdown” (LD), which has been in place since Nov 22. The observation period covers the full first week of this LD until Nov 28.
Our analyses are based on evaluations of telecommunications data that cover about one third of the Austrian population.
EVOLUTION OF 7-DAYS AVERAGE
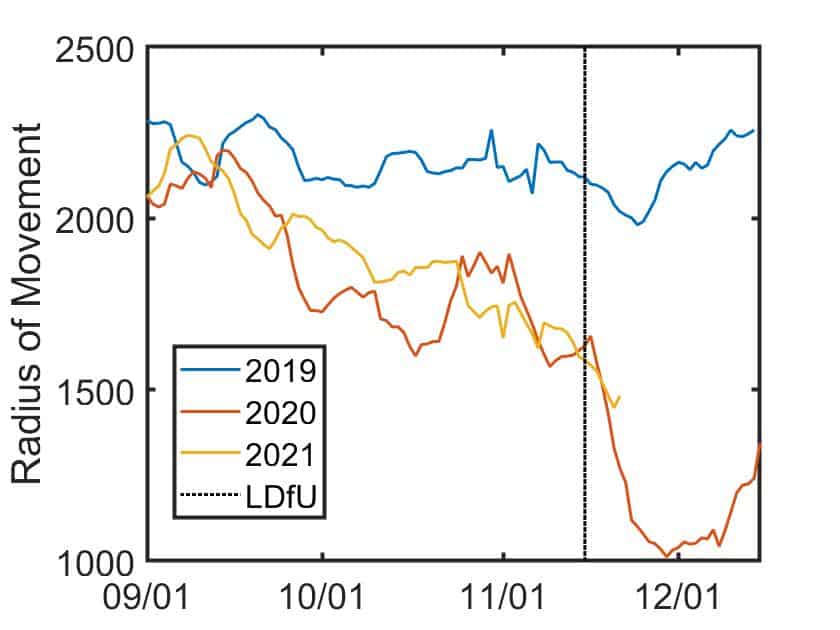
The evolution of the seven-day average of the median radius of gyration in Austria is shown in Figure 1 for September to December in the years 2019 (before the pandemic), 2020 (covering the 2nd LD) and 2021.
It becomes apparent that with the beginning of the 4th LD mobility decreased at a much steeper rate than during the weeks before and in particular during the LDfU. However, the mobility reduction has not yet reached a level as low as mobility during the 2nd LD in 2020. It remains to be seen how the situation will develop in the second week of this LD.
CHANGE IN MOBILITY IN FEDERAL STATES
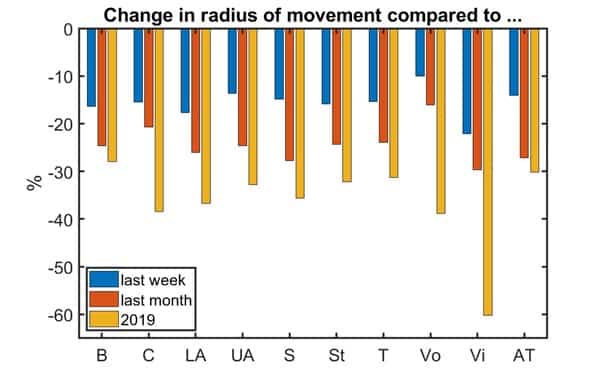
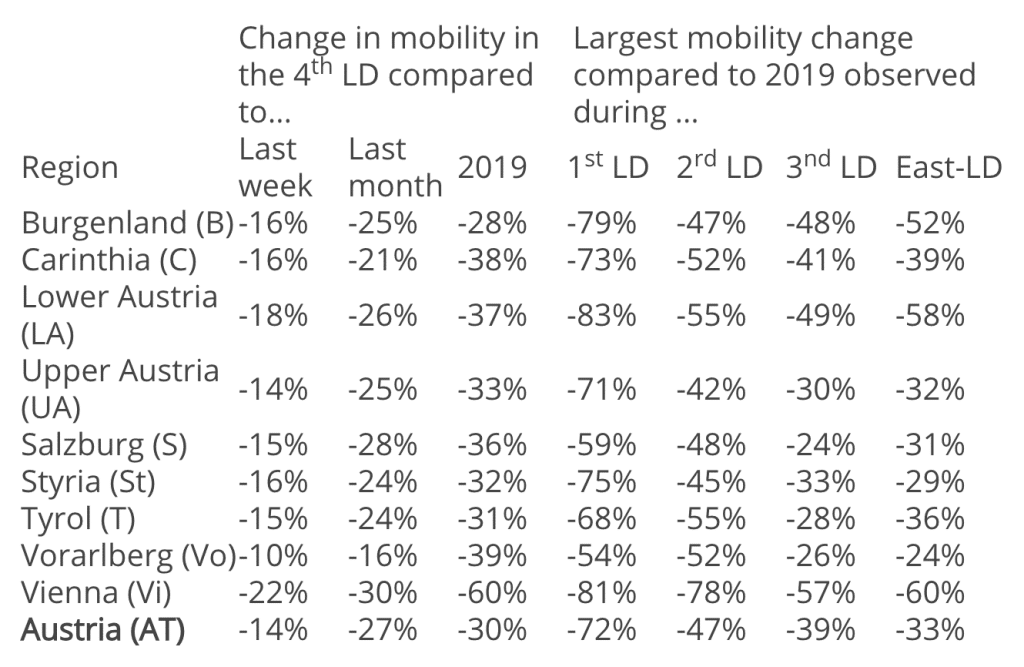
We show results for the mobility reduction across federal states in Figure 2 and Table 1. There we give the percent change in mobility (as measured by the median radius of movement) for the nine federal states and Austria between the first week of the 4th LD (Nov 22–28) with respect to the previous week (Nov 15–21, LDfU), previous month and 2019.
We observe the by far strongest mobility reduction in Vienna (almost 60% compared to 2019, whereas most other states lie in the 30%–40% range).


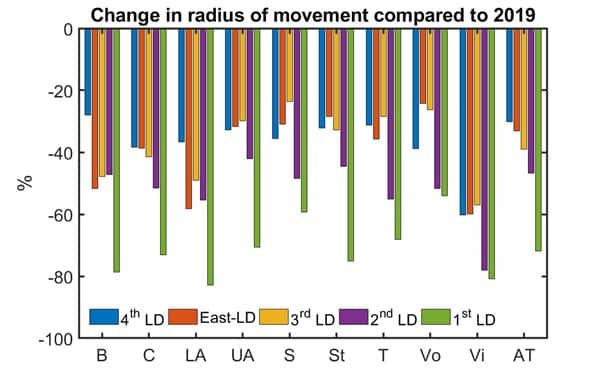
The mobility reductions across different LDs are shown in Figure 3. There we identify the week with the lowest level of mobility during each LD or partial LD (as it was the case for the East-LD) and give the percent change with respect to the same week in 2019. For all of Austria we clearly observe a gradual decrease in mobility reduction with each LD, from around 70% in the first to a bit more than 30% in the current LD. Similar patterns of decreased mobility can also be observed in each federal state.
Again, we observe a substantially smaller change in mobility reductions across the LDs in Vienna compared to all other federal states.
Note that these results are preliminary and it remains to be seen whether similar trends can be observed in the second week of the LD.
Regarding the difference between Vienna and other parts of Austria, we also note that this might also be confounded by a “metropole effect”, i.e., that mobility reduction is easier to achieve in an urban infrastructure when compared to more rural areas of the country.
TABLE 1: SUMMARY OF RESULTS REGARDING THE CHANGE IN MOBILITY IN FIGURES 1–3 IN AUSTRIAN REGIONS


